Kapitan EdgeSRE
Agentic Incident Management & Root Cause Analysis
AI agents that investigate production incidents across your cloud and Kubernetes stack the moment they happen — surfacing the exact root cause in minutes, with cited evidence, not just another alert.
AI Agents That Investigate Before You Even Open a Ticket
Kapitan EdgeSRE runs LLM-orchestrated agents that autonomously investigate incidents across your infrastructure — GCP, AWS, Azure, OVH, Scaleway, and Kubernetes anywhere it runs. Instead of an engineer chasing dashboards at 3am, the agent has already pulled the logs, checked the deploys, and drafted a finding.
FussMobile deploys, tunes, and operates the full agent platform on top of your existing monitoring and Kubernetes stack — integrations, guardrail policy, knowledge base, and 24/7 platform operations included.
FussMobile Managed Includes
- ✓ Agent deployment across your cloud and Kubernetes environments
- ✓ Integration setup for your monitoring, paging, and ticketing stack
- ✓ Guardrail policy tuning (what the agent may query vs. execute)
- ✓ Knowledge base onboarding — runbooks, architecture docs, escalation paths
- ✓ Model provider configuration and cost governance
- ✓ 24/7 monitoring of the agent platform itself
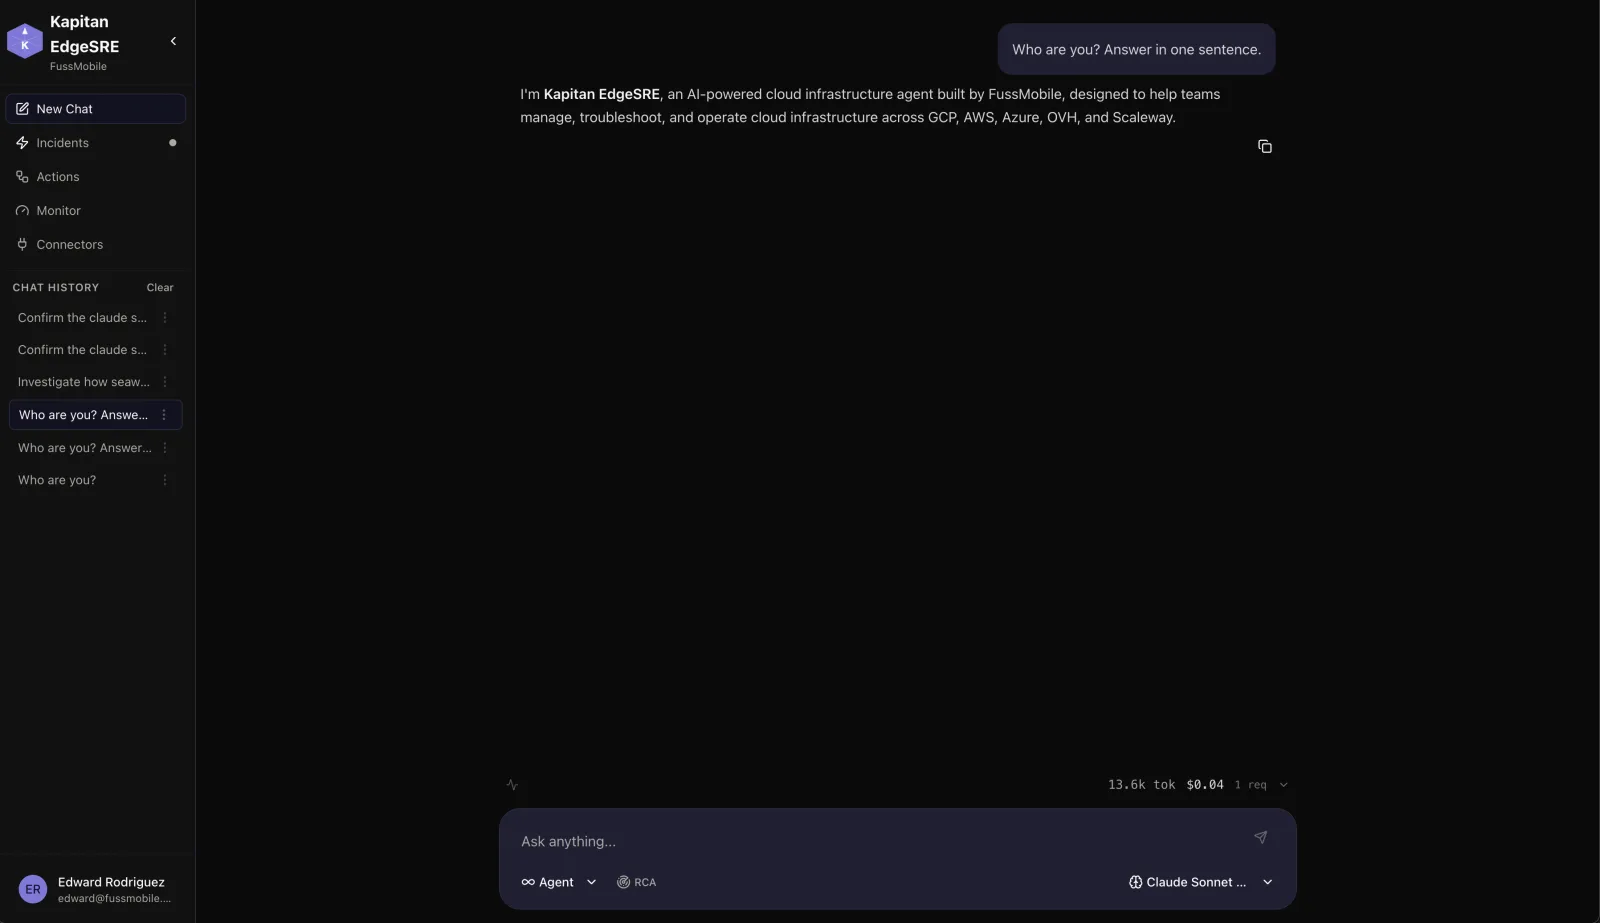
Ask It What It Does
This isn't mockup copy — it's a live response from a running Kapitan EdgeSRE deployment, describing its own scope in one sentence.
- ✓ Investigates automatically the moment an alert fires — no one has to kick it off.
- ✓ Every finding cites the evidence it used — logs, metrics, deploy diffs, trace IDs.
- ✓ One-click remediation: open a PR, or execute the fix directly within your guardrail policy.
See the Platform
Real screenshots from a live Kapitan EdgeSRE deployment.
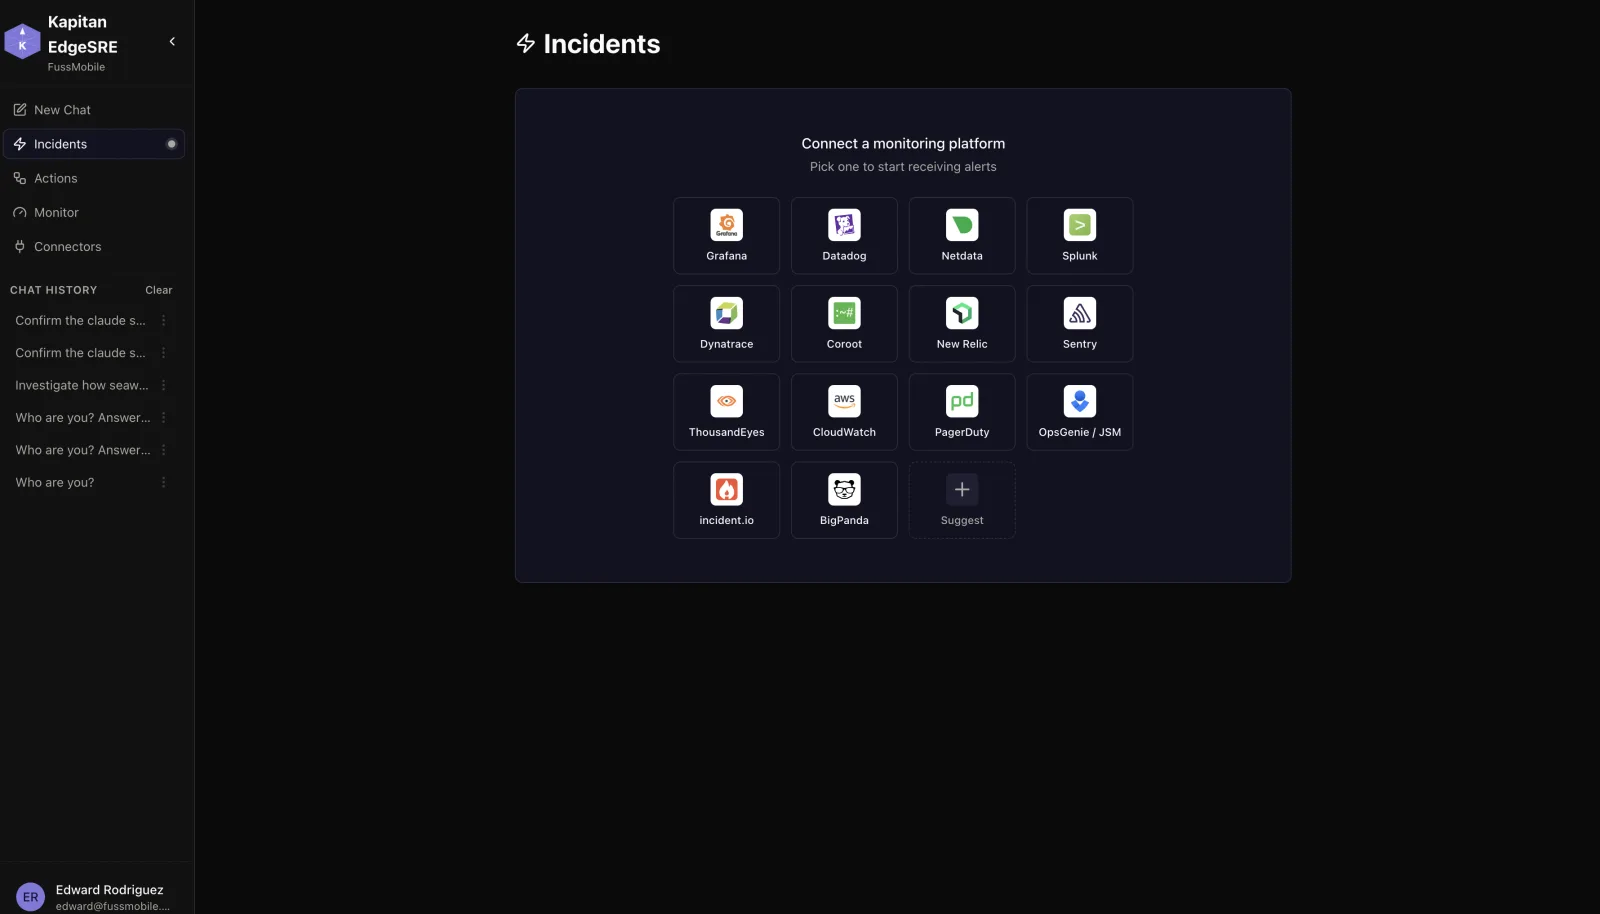
Start Receiving Alerts in One Click
Connect a monitoring platform — Grafana, Datadog, Splunk, Dynatrace, PagerDuty, OpsGenie, incident.io, and more — and Kapitan EdgeSRE starts investigating the moment an alert fires.
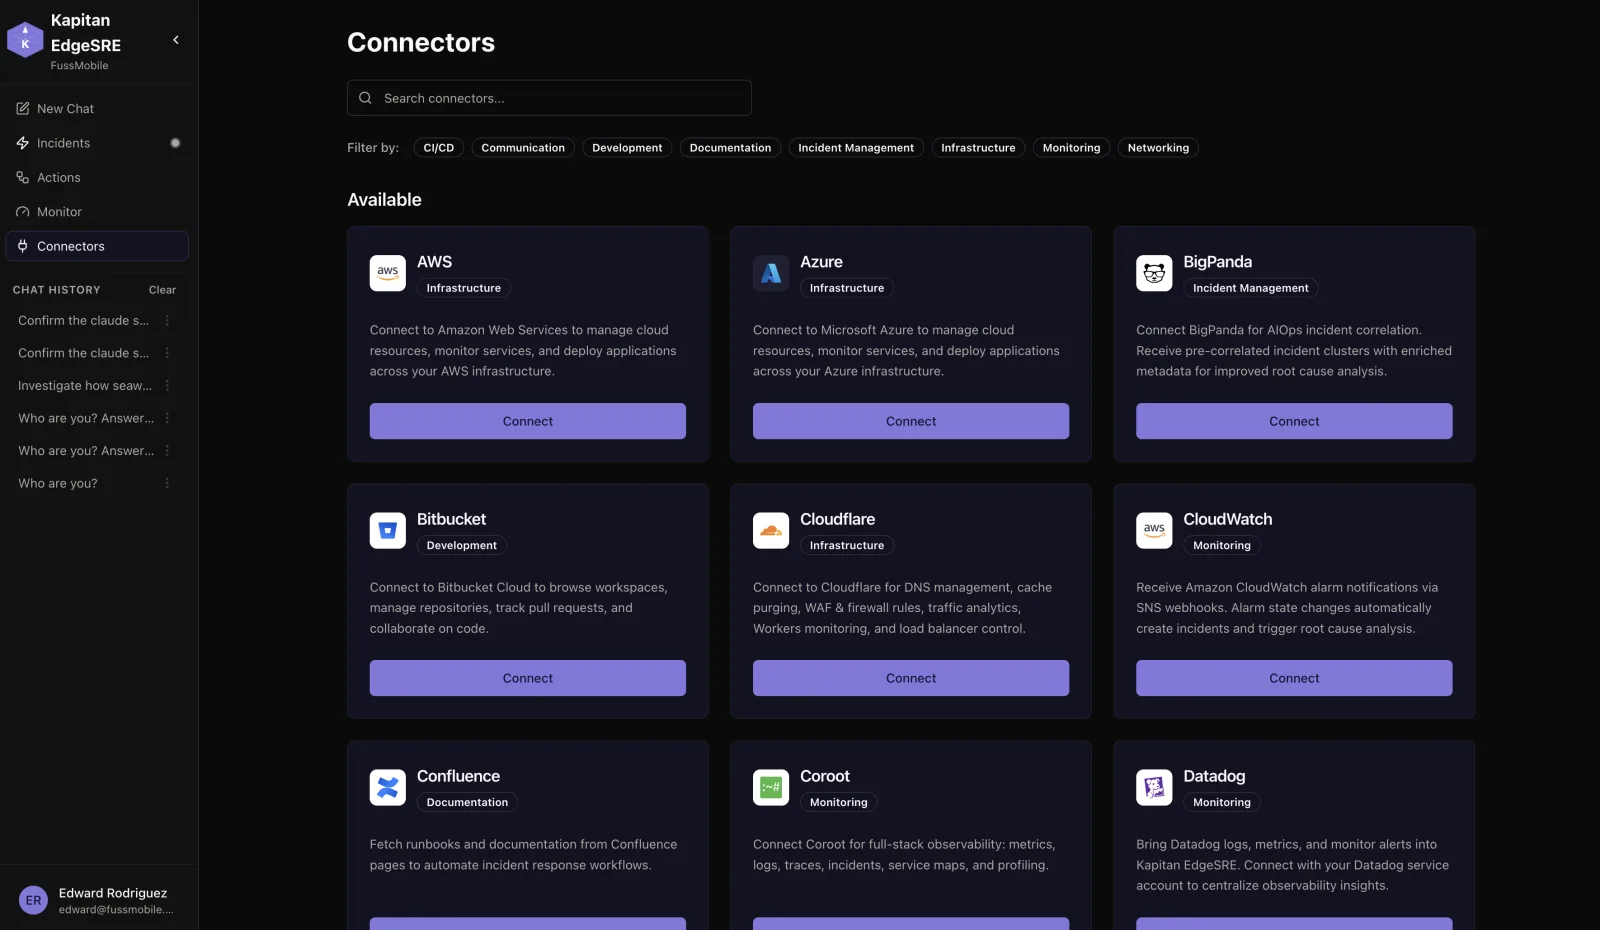
Connect Your Entire Stack
AWS, Azure, Datadog, PagerDuty, Confluence, Bitbucket, Cloudflare, and dozens more — one-click connectors, filterable by category across CI/CD, monitoring, incident management, and infrastructure.
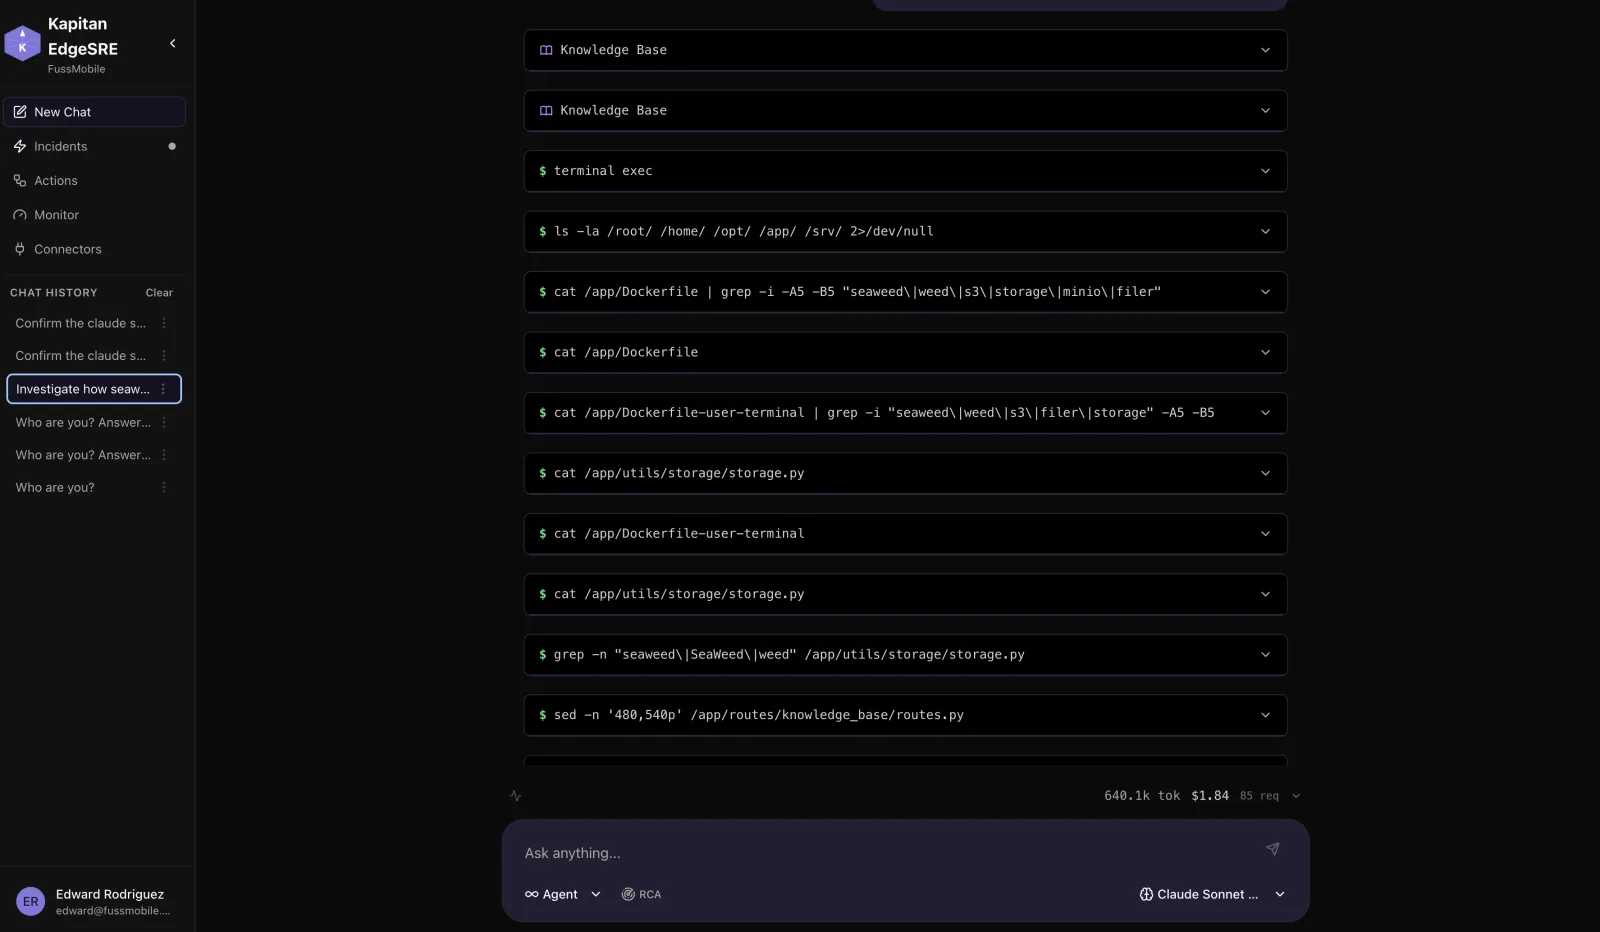
Watch It Work
Mid-investigation, the agent runs its own terminal commands against your infrastructure — inspecting configuration, source, and deploy artifacts to trace an issue back to its root, all within the guardrail policy your team defines.
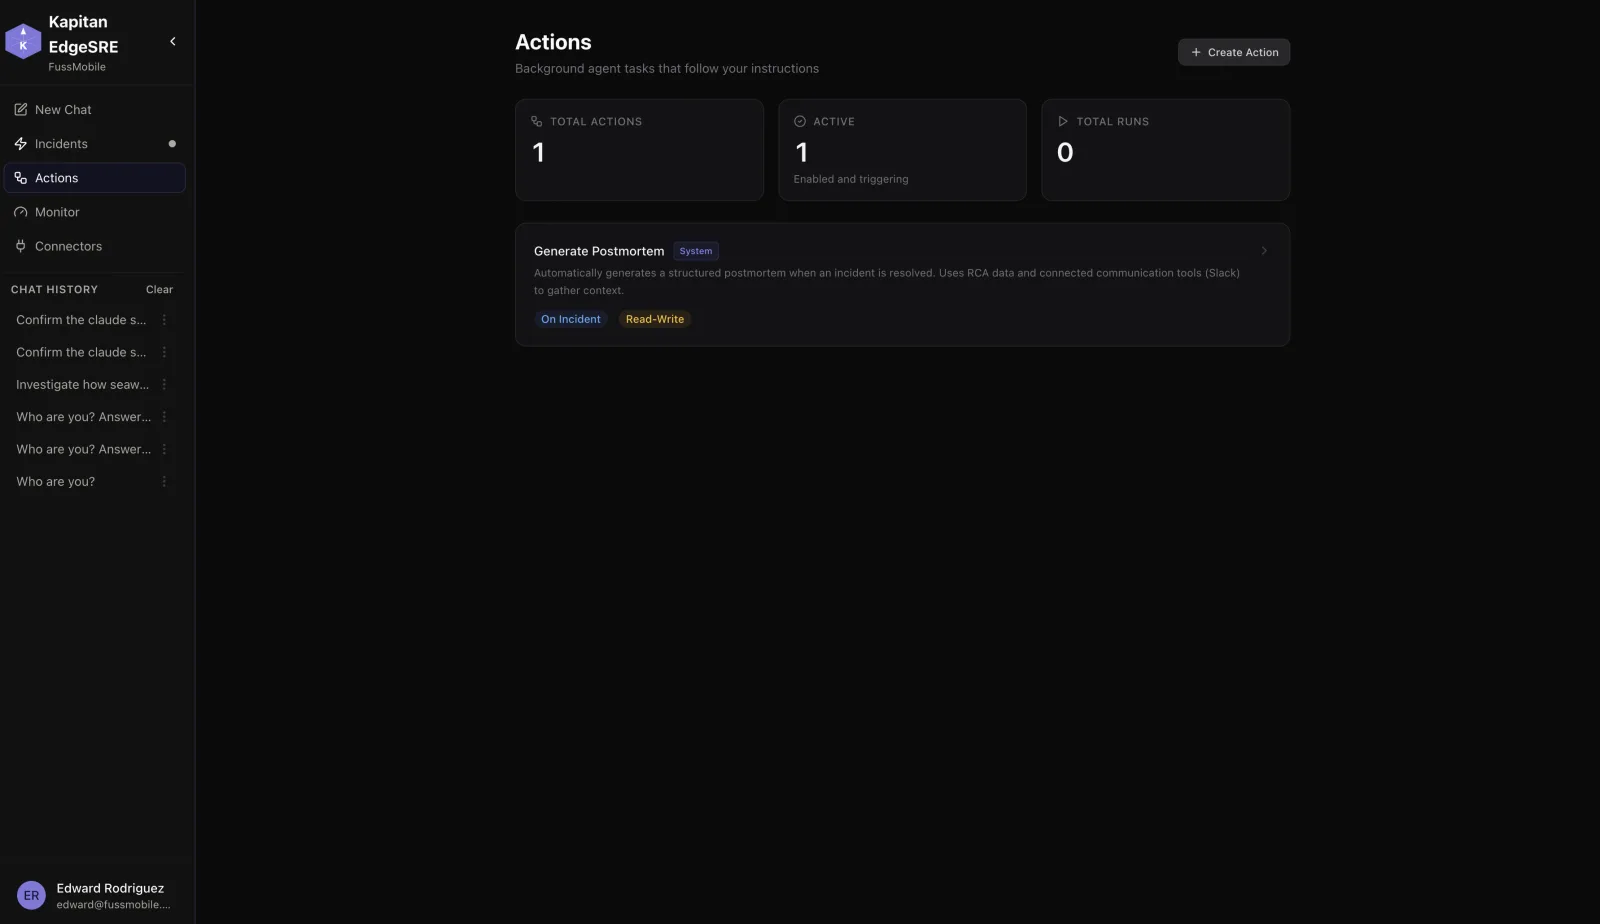
Automate the Recurring Work
Background agent tasks that follow your instructions — like automatically generating a structured postmortem the moment an incident resolves, pulling RCA data and Slack context on its own.
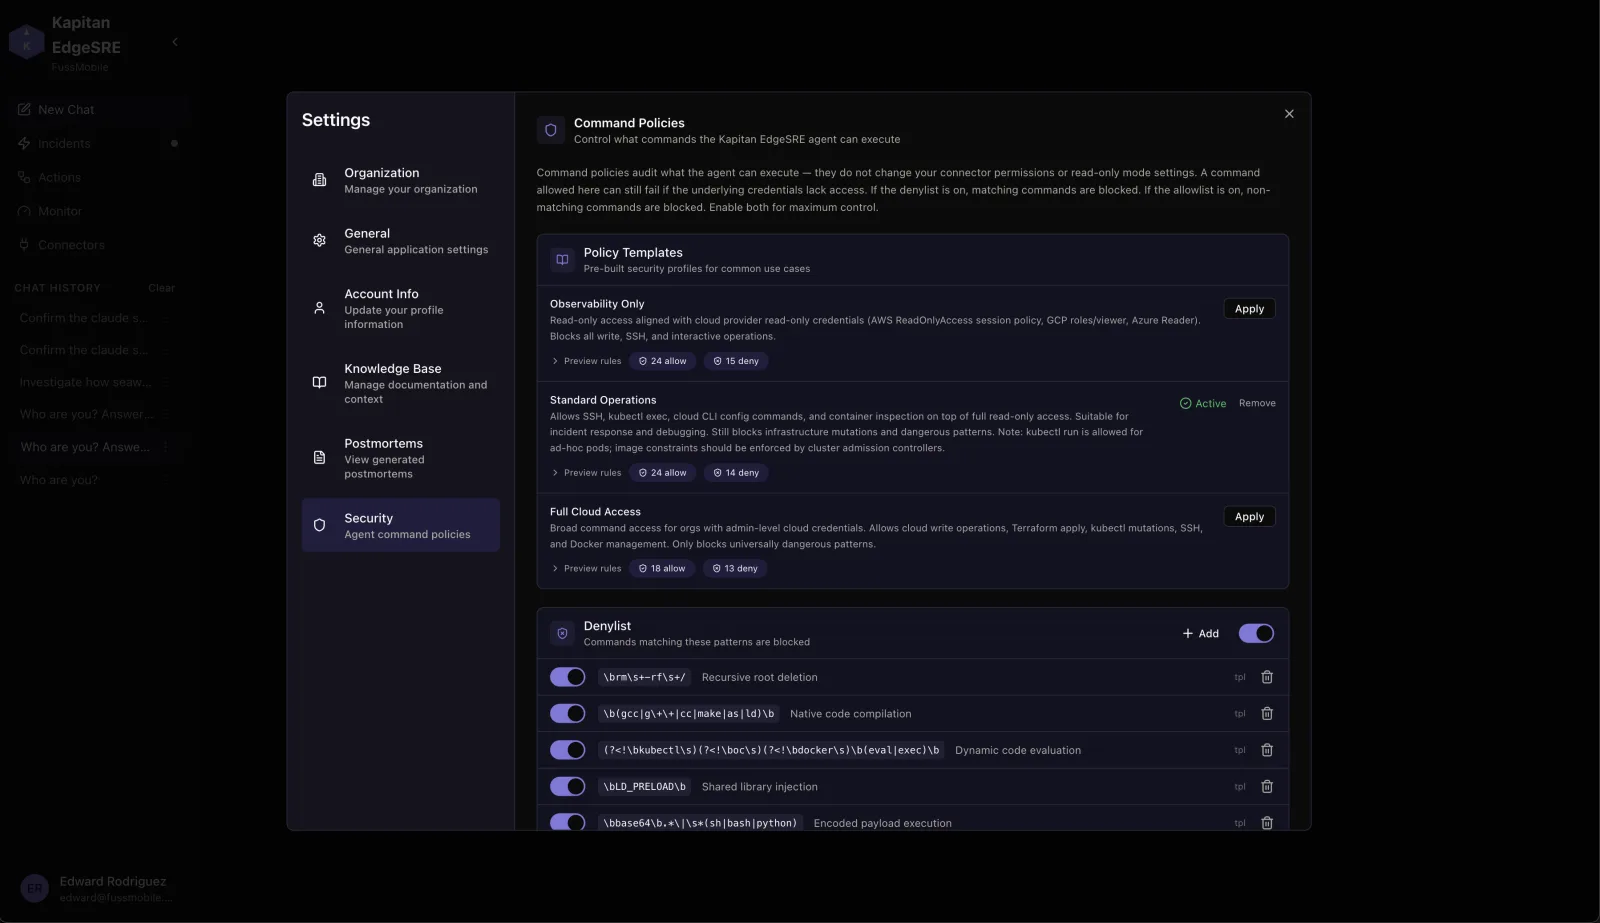
Guardrails You Control
Pre-built policy templates — Observability Only, Standard Operations, Full Cloud Access — plus a fully custom allow/deny list down to the regex pattern. Command policies sit independently of connector permissions, so you get two layers of control.
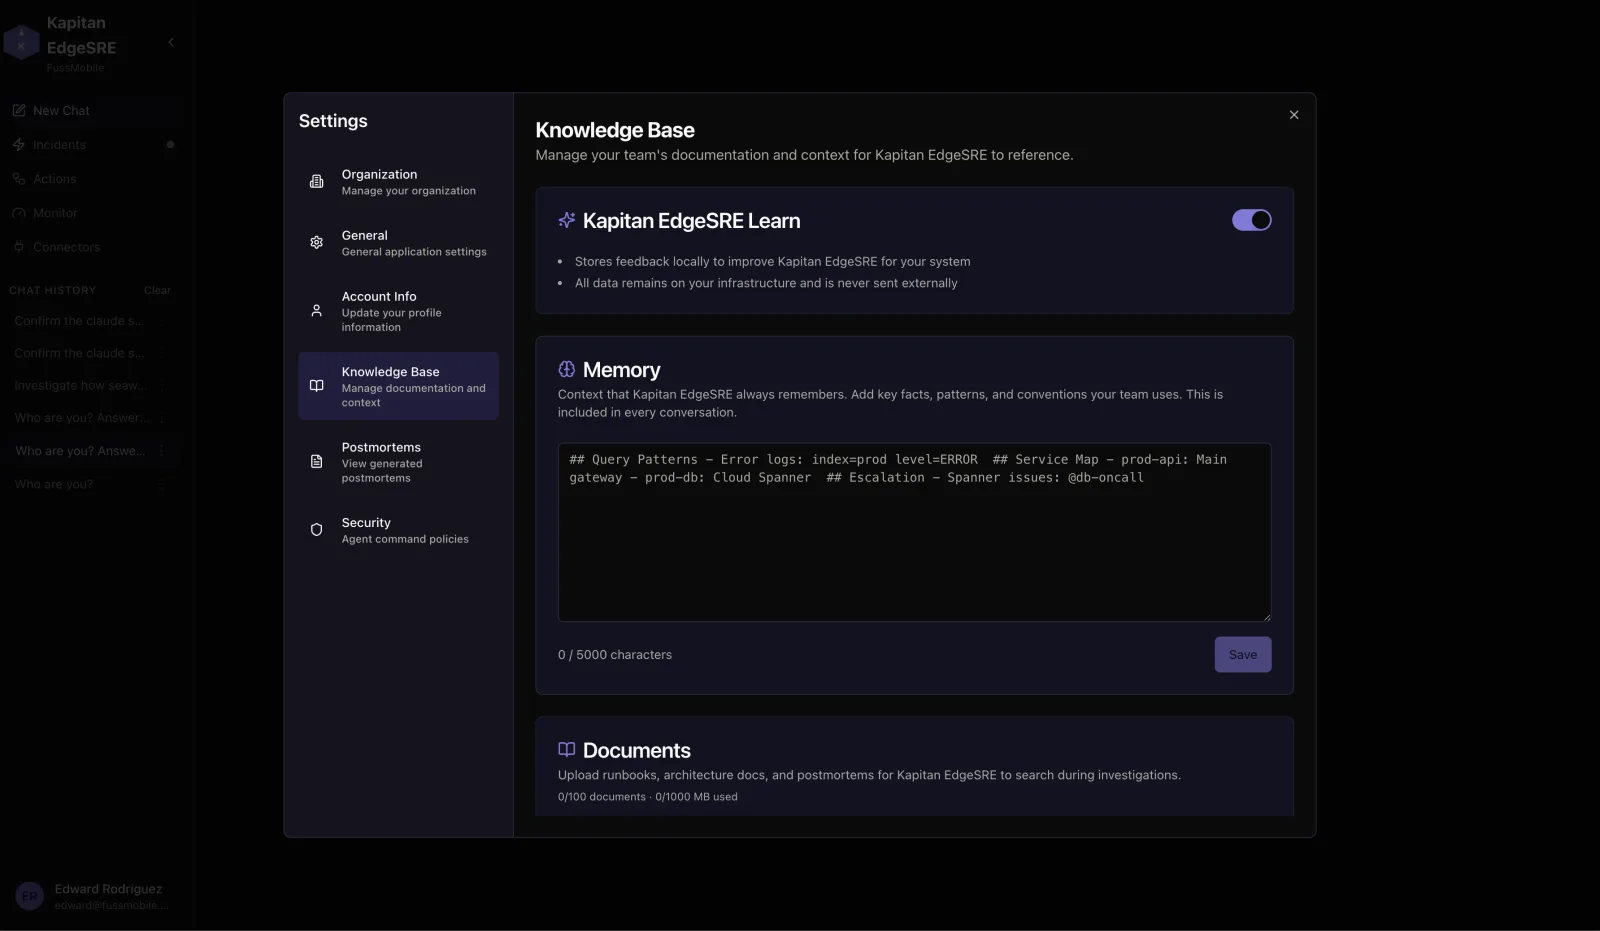
A Knowledge Base That Keeps Learning
Runbooks, architecture docs, and team memory the agent references on every investigation. Feedback used to improve Kapitan EdgeSRE stays local to your infrastructure and is never sent externally.
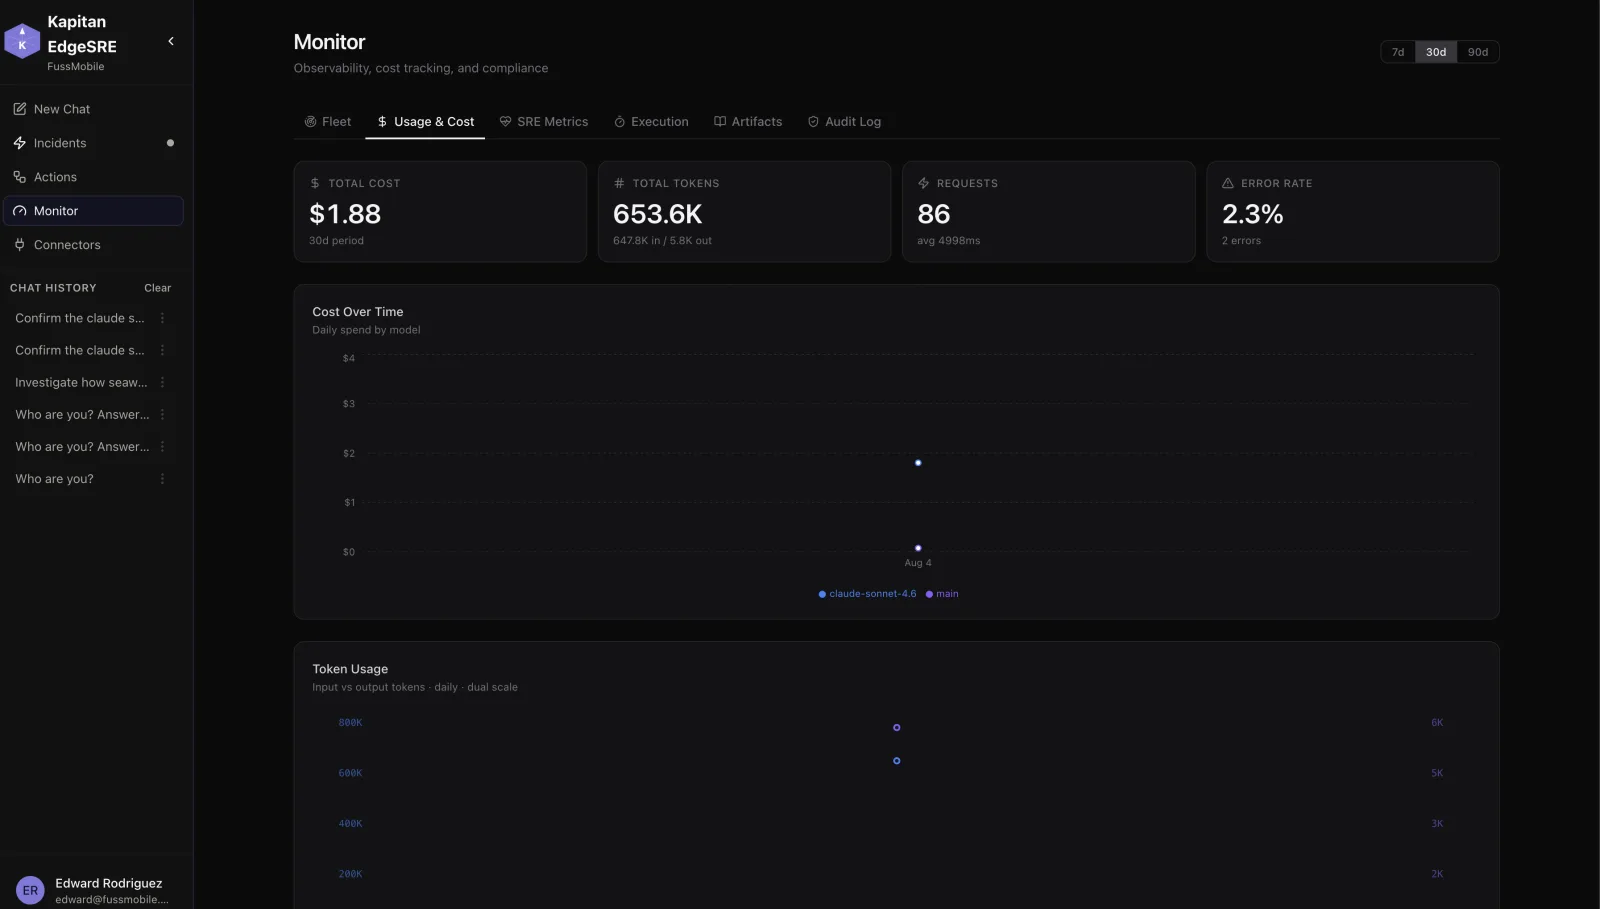
Full Visibility Into Cost, Usage, and Compliance
Fleet health, spend by model, SRE metrics, execution history, and a complete audit log — the operational visibility finance and compliance teams expect from day one.
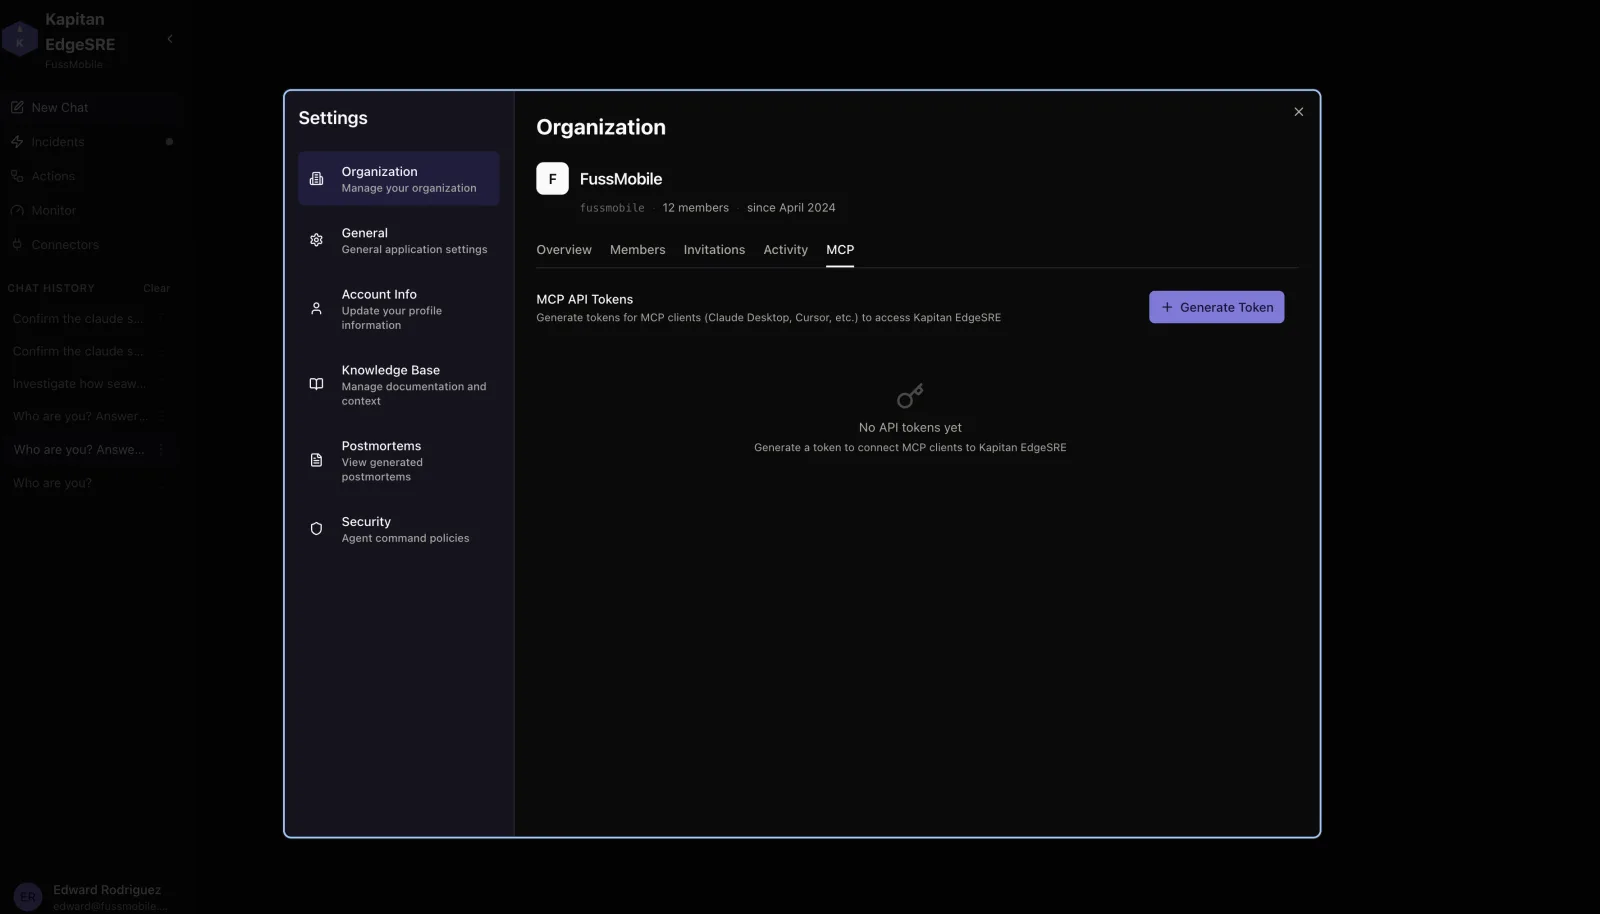
Expose Infrastructure Context to Your AI Tools
Generate an MCP token and give Claude Desktop, Cursor, or any MCP-compatible client direct access to Kapitan EdgeSRE's incidents, topology, and RCA findings.
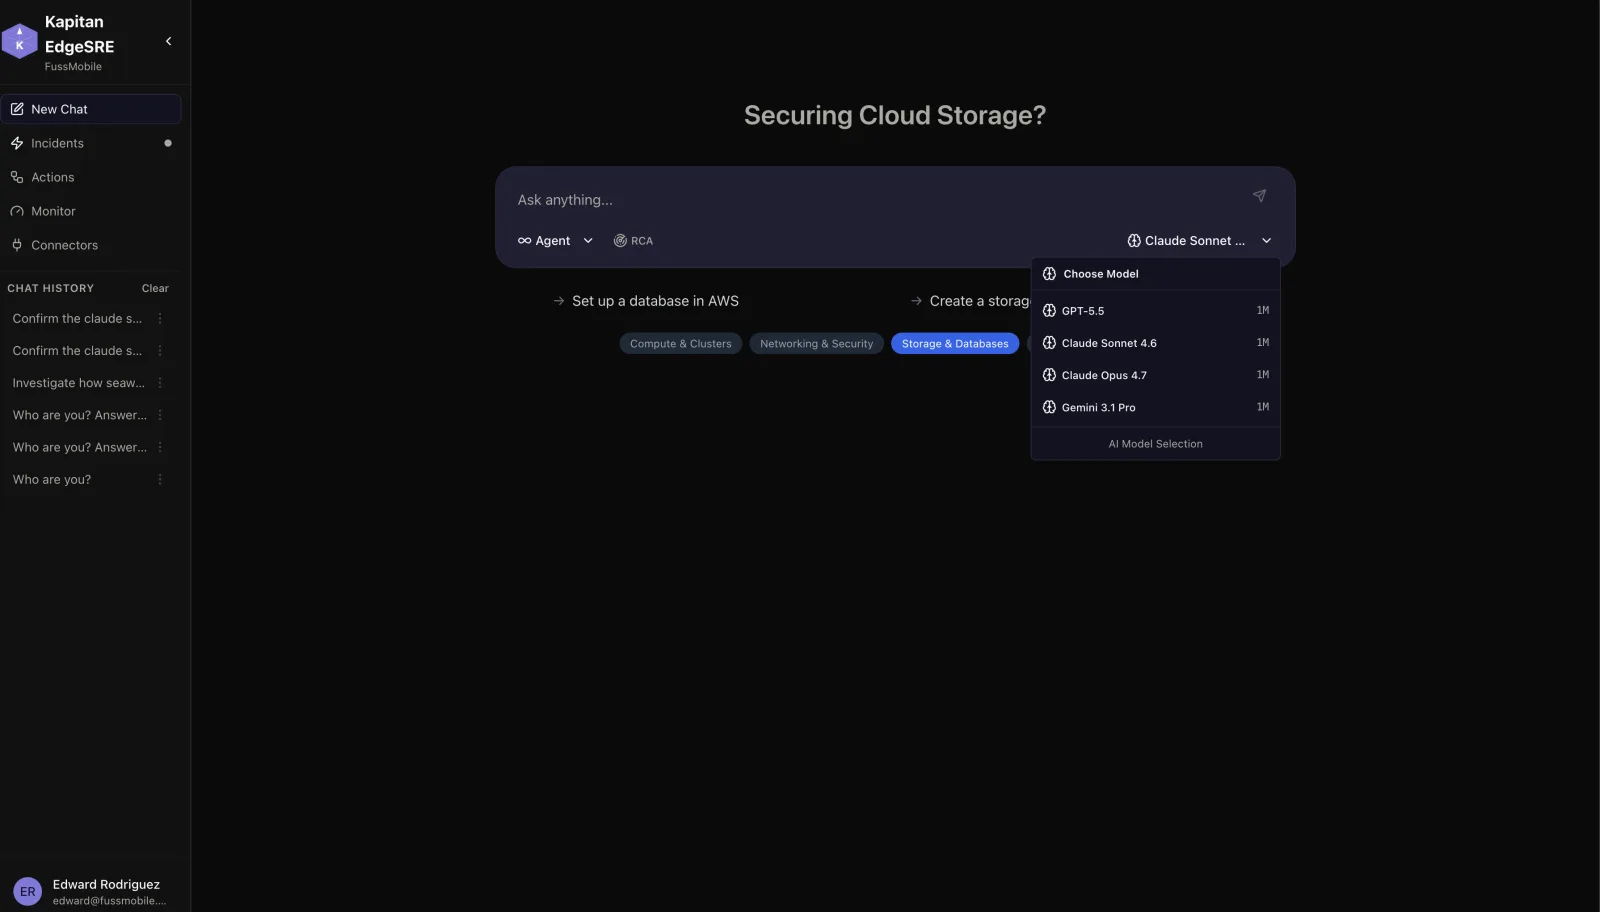
Bring Your Own Model
Run on GPT-5.5, Claude Sonnet, Claude Opus, Gemini, or whatever your team standardizes on — with guided starting points for compute, networking, and storage tasks.
See Kapitan EdgeSRE Investigate
A representative walkthrough of how an investigation unfolds — not a real customer incident.
Scenario: a checkout service starts throwing gateway timeouts under normal load. On-call is paged with a generic latency alert and no further context.
- Agent receives the PagerDuty alert and opens an investigation automatically.
- Pulls recent deployment history and checks for anything that shipped in the incident window.
- Inspects the database and finds a lock wait pattern coinciding with the latency spike.
- Cross-references the migration file from the flagged deploy and identifies an operation that silently escalated to an exclusive lock.
- Assembles the root cause with linked evidence, and proposes terminating the blocking process plus a follow-up fix to the migration.
Result: root cause identified and evidence assembled in minutes, instead of an engineer manually correlating deploys, logs, and database state by hand.
Priced Around How Your Team Operates
Kapitan EdgeSRE is deployed and priced as a managed engagement, not a self-serve checkout. Every plan includes deployment, integration setup, and guardrail tuning by FussMobile.
Starter
For teams standing up their first agentic on-call
- ✓ Up to 5 connected monitoring platforms
- ✓ Standard guardrail policy templates
- ✓ Knowledge base onboarding (runbooks & docs)
- ✓ Business-hours support
Team
For SRE teams running incident response at scale
- ✓ Unlimited connectors
- ✓ Custom guardrail policies & full audit log
- ✓ Dedicated knowledge base onboarding
- ✓ Priority support with response SLA
- ✓ Cost & usage monitoring dashboard
Enterprise
For multi-org, multi-cloud operations at global scale
- ✓ Everything in Team
- ✓ Multi-org / multi-tenant deployment
- ✓ Dedicated FussMobile SRE support engineer
- ✓ Custom model provider & cost governance
- ✓ 24/7 platform operations
Frequently Asked Questions
Ready to Automate Incident Investigation?
Talk to our team about deploying Kapitan EdgeSRE across your cloud and Kubernetes environments.
Talk to an SRE Automation Expert